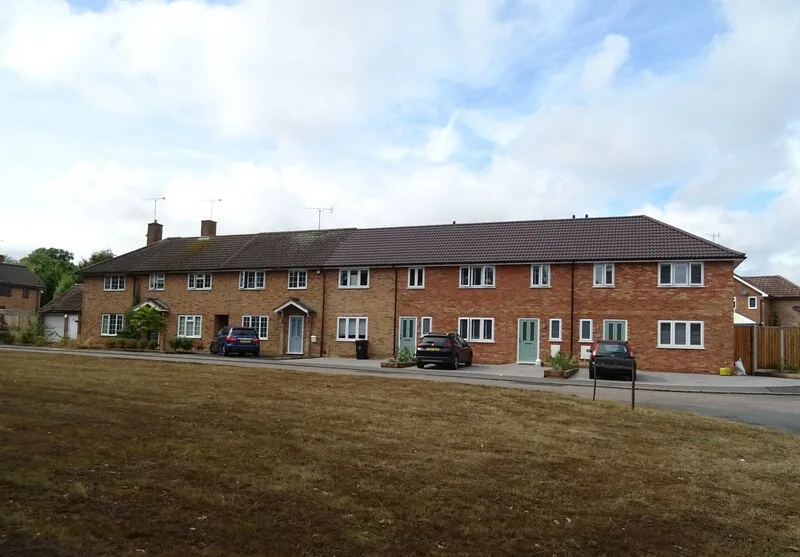

The average Brentwood home sold for £520,447 in September, up 0.2% on a year earlier. It is the first annual rise since May, but flats are still falling.
Overview
The average home in Brentwood borough sold for £520,447 in September 2026. That is £1,257 more than in September 2025, a rise of 0.2%. It is the borough’s first year-on-year rise since May, after three months of falls.
The figures are from HM Land Registry’s UK House Price Index for September, published on 18 November (UK House Price Index, Brentwood, September 2026).
The index is a mean average, not a median, so a few very expensive sales pull it up. It also revises as late sales are registered, and the summer figures have already moved (see below).
Three months of falls, then a small rise
Brentwood’s annual change went negative in June and stayed there through August. The latest Land Registry series now reads:
- May 2026: £523,142, up 0.5% on a year earlier
- June 2026: £509,425, down 2.3%
- July 2026: £514,783, down 2.3%
- August 2026: £519,794, down 0.3%
- September 2026: £520,447, up 0.2%
On the month, September was up £653, or 0.1%, on August (Brentwood, August 2026).
The borough is still below its level of a year earlier in the summer. In July 2025 the average was £526,910 (Brentwood, July 2025), about £6,500 above where it is now.
Second most expensive in Essex, ninth for growth
Brentwood remains the second most expensive place to buy a home in Essex, behind only Epping Forest at £536,719 (Epping Forest, September 2026). The Land Registry’s Essex average is £360,791, so a Brentwood home costs about £160,000 more than the county figure (Essex, September 2026).
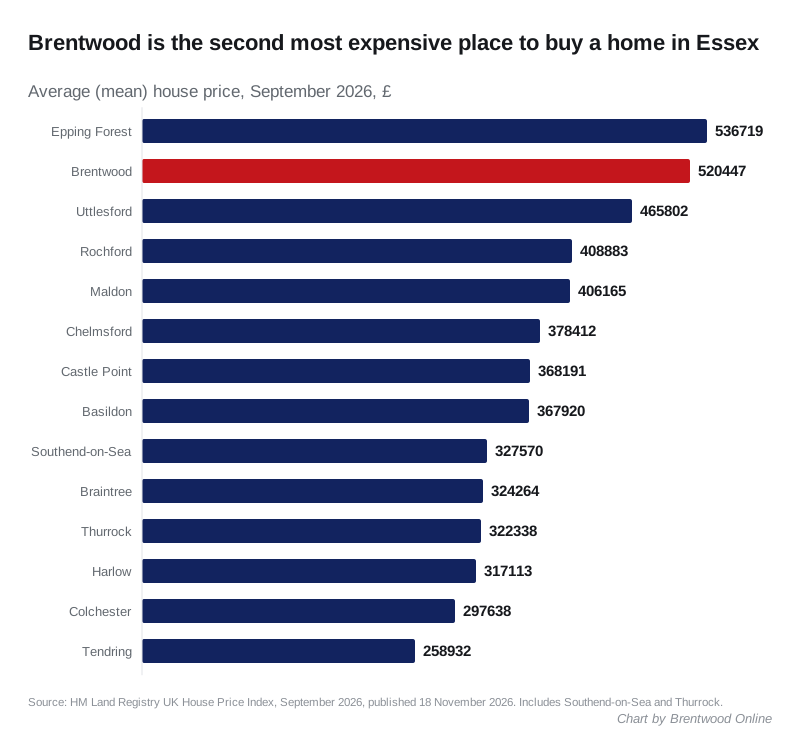
On growth, Brentwood sits in the middle of the pack. Its 0.2% rise is ninth of the 14 Essex areas. England as a whole rose 0.8% to £292,998 (England, September 2026).
| Area | Average price | Annual change |
|---|---|---|
| Maldon | £406,165 | +5.0% |
| Harlow | £317,113 | +3.9% |
| Epping Forest | £536,719 | +2.1% |
| Southend-on-Sea | £327,570 | +1.8% |
| Rochford | £408,883 | +1.3% |
| Colchester | £297,638 | +0.9% |
| Basildon | £367,920 | +0.8% |
| Braintree | £324,264 | +0.5% |
| Brentwood | £520,447 | +0.2% |
| Uttlesford | £465,802 | -0.5% |
| Castle Point | £368,191 | -0.7% |
| Thurrock | £322,338 | -0.7% |
| Chelmsford | £378,412 | -0.8% |
| Tendring | £258,932 | -2.2% |
Each figure is from that area’s own September 2026 page in the same Land Registry series.
Houses are up, flats are still down
Every type of house rose on the year. Flats did not (Brentwood, September 2025).
| Property type | Average price | Annual change |
|---|---|---|
| Detached | £996,190 | +1.1% |
| Semi-detached | £556,486 | +0.9% |
| Terraced | £435,986 | +1.0% |
| Flat or maisonette | £264,292 | -2.2% |
Flats are £5,839 cheaper than a year ago, down from £270,131. The average detached home is up £11,112 on the year but is still just under the £1m mark, at £996,190.
First-time buyers paid an average of £373,471, almost exactly what they paid a year earlier: down £269, or 0.1%.
The summer figures have been revised
When the July figures came out in September, the Land Registry put Brentwood at £514,480, down 2.4% on the year. The series now gives £514,783, down 2.3% (Brentwood, July 2026). The difference is small, but it is why one month’s rise or fall is worth treating with care. The September number will move too.
The number of September sales is not yet published for the borough. The Land Registry usually adds sales volumes a couple of months after the price.
What it means for you
- If you are selling, the average borough price is roughly where it was a year ago. The falls of the summer have not deepened, but prices have not recovered to the July 2025 level either.
- If you are buying a flat, prices are still drifting down, by 2.2% on the year. That gives buyers more room to negotiate than on houses.
- If you are a first-time buyer, the average you are competing with, £373,471, has barely changed in 12 months.
Have your say