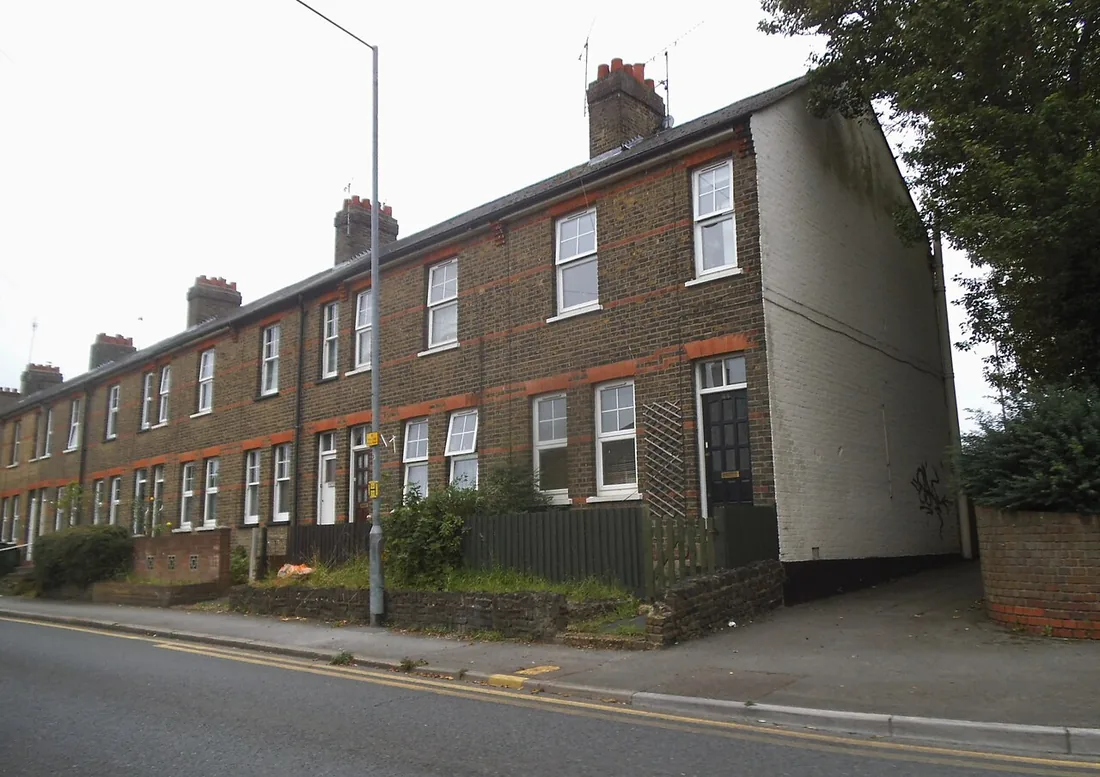

The average Brentwood home sold for £514,480 in July 2026, down 2.4% in a year. Prices by property type, what first-time buyers pay, and how it compares.
Asking prices in the windows along Brentwood High Street tell you what sellers hope for. The figure that counts is what homes actually change hands for, and that is recorded by HM Land Registry once a sale completes. This page is a plain read of those numbers for Brentwood borough: the average price, which way it is moving, what you pay by property type, what first-time buyers and movers pay, and how the borough sits against the East of England and England.
The headline figure
The provisional average house price in Brentwood in July 2026 was £514,480, according to the UK House Price Index, which is built from completed Land Registry sales rather than asking prices.
That is down 2.4%, or £12,430, on the £526,910 average of July 2025. The direction has turned: a year ago the borough was growing at 5.6%. The East of England rose 0.5% over the same twelve months and England rose 1.1%, so this is a local fall rather than a national one. Of the 14 local authority areas in Essex, only Castle Point is falling faster.
Brentwood remains the second most expensive place to buy in Essex. Only Epping Forest, at £525,719, has a higher average.
We report each monthly release as it lands. The most recent is the July 2026 figures in full.
What it means for you
If you are buying, the gap between property types matters more here than the headline average does. The average is dragged upward by Brentwood’s detached stock, and a terraced house costs less than half what a detached one does. Work from the type figures below, not from £514,480.
If you are selling, a falling year is not a market that rewards optimistic pricing. Homes priced against a 2022 peak tend to sit.
If you are staying put, your home is worth a little less on paper than it was a year ago. That matters only if you are moving or remortgaging, and a single month of this index is a wobble rather than a trend.
Prices by property type
The headline average hides a very wide spread. These are the Brentwood borough averages for July 2026 from the UK House Price Index:
- Detached houses: £986,621, down 1.7% over the year. The average detached home in the borough slipped back under £1 million in June and stayed there in July.
- Semi-detached houses: £548,717, down 1.5% over the year.
- Terraced houses: £430,877, down 1.3% over the year.
- Flats and maisonettes: £261,716, down 4.8%, much the steepest fall of the four.
The pattern is worth reading carefully. Flats are taking most of the fall, and the detached top end is what pulls the borough average up to £514,480. Almost nobody actually pays the average.
First-time buyers and home movers
The same data splits buyers a second useful way. In July 2026 a first-time buyer in Brentwood paid an average of £369,155, down from £379,084 a year earlier. A home mover, someone selling one property to buy another, paid an average of £680,308, down from £694,904 (UK House Price Index).
That £311,153 gap is, in practical terms, the size of the step in this borough from a first flat or terrace to a family house. It is why so much of Brentwood’s turnover happens in the semi-detached band.
There is one more split worth knowing. Buyers with a mortgage paid an average of £512,389 and cash buyers paid £522,084, so cash is not buying at a discount here. Cash buys speed and certainty rather than a lower price.
How Brentwood compares
| Area | Average price (July 2026) | Annual change |
|---|---|---|
| Brentwood borough | £514,480 | -2.4% |
| Essex | £359,978 | -0.3% |
| East of England | £337,518 | +0.5% |
| England | £293,479 | +1.1% |
| United Kingdom | £272,611 | +1.4% |
Sources: UK House Price Index, Brentwood, July 2026 and the UK House Price Index reports.
In plain terms, the average Brentwood home costs roughly £177,000 more than the typical home in the East of England and about £221,000 more than the England average. The reasons are not mysterious: green belt covers around 89% of the borough, which caps how much new housing can be built, and the Elizabeth line and Liverpool Street trains put central London inside forty minutes of Brentwood station. Constrained supply plus a fast commute is the whole story.
What actually sold, by postcode area
Averages smooth out the differences between Brentwood, Shenfield, Hutton and Ingatestone. To show those, we pulled every completed sale registered in the borough’s four postcode districts for the first quarter of 2026 straight from HM Land Registry’s open Price Paid data. That is 187 sales between 1 January and 31 March 2026, and these are the medians, the price of the middle sale rather than the average:
| Postcode district | Main town | Sales | Median price | Range |
|---|---|---|---|---|
| CM4 | Ingatestone | 26 | £640,500 | £156,000 to £3,480,000 |
| CM15 | Shenfield | 66 | £535,950 | £100,000 to £1,735,000 |
| CM13 | Hutton | 28 | £522,500 | £210,000 to £2,500,000 |
| CM14 | Brentwood town | 67 | £372,000 | £95,000 to £1,510,000 |
Two things jump out. Ingatestone’s CM4 is the most expensive postcode in the borough, with a median £268,500 above Brentwood town’s. And CM14, the town centre postcode, is the cheapest by a wide margin, not because Brentwood is cheap but because that is where the flats are: nearly half the CM14 sales in the quarter were flats or maisonettes.
The same 187 sales, split by property type, give a median of £811,250 for a detached house, £553,000 for a semi, £425,000 for a terrace and £270,000 for a flat. Compare the detached figure with the £1,010,000 average further up the page and you can see what a handful of very large sales does to a mean: one CM4 sale in the quarter went for £3,480,000.
Two health warnings on these numbers. They are medians of a single quarter, so a small sample in CM4 and CM13 moves easily. And every one of Brentwood’s four postcode districts is shared with a neighbouring council, so a minority of these sales sit in Basildon, Havering, Thurrock, Chelmsford or Epping Forest rather than in this borough. They describe the postcode area, not the local authority.
Checking a specific street or house
Every completed sale in England and Wales is public. To see what a particular address or road sold for, use the free HM Land Registry Price Paid search, which covers Brentwood’s CM13, CM14, CM15 and CM4 postcodes and lets you filter by street, date and property type. It is the same underlying data the averages on this page are built from, so it is the right place to settle an argument about a specific house rather than the borough as a whole.
Two things to watch when you compare. First, all four Brentwood postcode areas are shared with neighbouring districts, so a CM13 or CM4 result may sit in Basildon, Havering, Thurrock, Chelmsford or Epping Forest rather than in this borough. Second, portal averages for “Brentwood” are usually weighted toward the larger detached homes in Shenfield, Hutton and Ingatestone, which is why they often read well above the Land Registry figure. Both numbers can be right; they are measuring different things.
Frequently asked questions
What is the average house price in Brentwood?
The provisional average was £514,480 in July 2026, according to the UK House Price Index, built from completed HM Land Registry sales across Brentwood borough.
Are Brentwood house prices going up or down?
Down. Prices fell 2.4% in the year to July 2026, against a 0.5% rise across the East of England and a 1.1% rise across England. Of the 14 local authority areas in Essex, only Castle Point fell further.
How much is a detached house in Brentwood?
£986,621 in July 2026, roughly three and three quarter times the average flat and nearly double the average semi. It is back under £1 million after three months above it.
What does a first-time buyer pay in Brentwood?
An average of £369,155 in July 2026, down from £379,084 a year earlier.
Is Brentwood expensive compared with the rest of Essex and the East?
Yes. The borough average is £177,000 above the East of England average of £337,518 and £154,502 above the Essex average. Only Epping Forest is dearer in Essex.
Sources
- UK House Price Index data, Brentwood, July 2026 (HM Land Registry) for the borough average, property-type figures and buyer-type figures.
- UK House Price Index reports (GOV.UK / HM Land Registry) for the Essex, East of England, England and UK averages.
- HM Land Registry Price Paid open data for the 187 completed sales registered in CM4, CM13, CM14 and CM15 between 1 January and 31 March 2026, from which the medians in this page are calculated.
- HM Land Registry Price Paid search to check any individual address.
Figures are provisional and are revised as more sales complete. Confirm the latest numbers against the linked ONS and HM Land Registry sources before making a decision.
Have your say